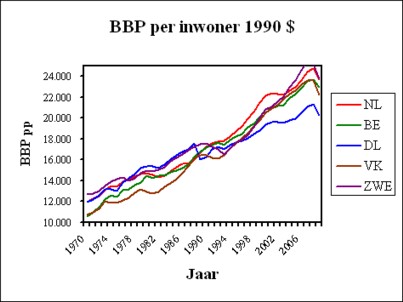
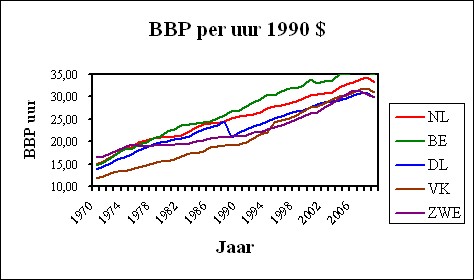
Figure 1: GDP per inhabitant (in $ of 1990) for the
Netherlands, Belgium, Germany, Great Britain and Sweden
After a deep recession during the early eighties of the last century, the Dutch economy has developed quite well, also in comparison with the European neighbouring states. This is caused by a package of radical social reforms. The present column illustrates this development with the help of economic indicators, such as the economic growth, labour participation, the costs of insurance for the disabled, the participation of older men, the labour productivity, and the investment quote.
The period 1962-1982 in the Netherlands is characterized by an economic decay. The increasing social collapse is analyzed in detail in two previous columns. The two primary causes can be identified fairly easily. First, the workers succeed in extorting excessive wage rises, with as extremes a real increase of 7% in 1964 and 8% in 1969. It is obvious that these rises are disastrous for the international competitive position. Second, the ideological pillars (catholic, protestant, socialist) rapidly lose their support within the population. The authority of the ideological leaders disappears, so that they can no longer energetically defend the general interest.
On a closer inspection, these two explanations, namely the wage explosion and the lost authority, are more the symptoms than the deeper cause of the economic decay. These fundamental causes can only be found by an analysis of the social structure, that is to say, of the system of institutions, which guide and limit the social behaviour. Viable institutions must offer a latitude for the social progress (innovations), which emerge from the system itself and from its environment. Apparently this was not the case in the corporatist order, which the Netherlands installed immediately after the Second Worldwar. This is in essence an internal development. The pillars tried to continue their existence and power by the establishment of various bodies of public law. Institutes such as the Socio-Economic Council (SER) were paternalistic, which fitted poorly with the rise of individualism1.
Moreover, the corporatism was combined with central planning, which leads to unsatisfactory economic results. Notorious is the guided wage policy, which curbed the wage rise in a top-down manner. This institution was favourable in the short term, but it caused social tensions, which explode in the long run, with serious consequences. All these problems are made worse by foreign influences, which stimulated progress. The economy (trade, and later also the production) becomes more and more international. This can not be reconciled with the national planning. Furthermore, globally a movement of counterculture emerged, which has undermined the existing authority. It began in the United States of America, but in 1966 it also obtains a foothold in the Netherlands. It had the New Left as its political component, an individualistic and unfortunately also destructive current.
Thus in 1982 the Netherlands had got in a position, where politics found it difficult to govern. A typical symptom was the cabinet Van Agt 2 (CDA - PvdA - D66), which already fell after a month in office, and again after nine months. This instability must mainly be attributed to the ideological confusion of the social-democracy. Since 1980 the Netherlands got in a deep economic recession, which actually had been provoked by the second oil crisis of 1979. In this situation of a general slump at last the sense of urgency arose, which is needed to realize institutional reforms. Under the cabinets Lubbers (1, 2 en 3) and subsequently the Purple cabinets Kok (1 and 2) a complete package of improvements was realised. The present column sketches the results of this social innovation.
In this paragraph the Dutch developments after 1982 are illustrated by means of several economic time series of essential policy indicators2. They show how the Netherlands performs in comparison with the neigbouring European states. Als points of reference, notably Belgium, Germany, Great Britain, and Sweden have been chosen. It is interesting, that these states differ in their social order. The first two states are of the continental type. Their order resembles corporatism. The social order of Great Britain is Anglosaxon. Its policy is liberal. Sweden is an example of the Scandinavian type, which is also called social-democratic. The data originate from the files of the OECD, of the Worldbank and of (at least in the past) the Groningen Growth and Development Centre3.
The growth of the gross domestic product (in short GDP) illustrates well the economic performances, despite the common criticism with regard to this indicator. The figure 1 shows the development between 1970 and 2010 (source: OECD). It is extremely informative. Consider for the sake of convenience the Belgian curve as a reference. In 1970 the Netherlands is clearly wealthier, but in 1982 the difference has gone4. However, the Dutch reforms are successful, and since 1985 there is a return to the old growth path. The German curve could also function as a reference, but in 1990 the FGR and the GDR are united. The establishment of a market economy in the former GDR affects the West-German welfare.
The growth path of Great Britain is not very salient. After 1979 the government Thatcher reforms the British economy. For a moment this causes stagnation, but after 1983 the tide turns, and in 1988 the Netherlands are even (temporarily) surpassed5. In the Swedish growth path the serious recession since 1991 is apparent. It takes until 1995, for Sweden to recover. This makes clear, that the Scandinavian model is rather less solid and attractive, than some believe.
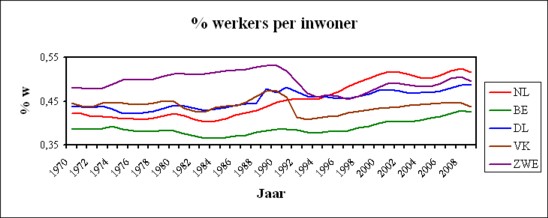
At first sight the Dutch development since 1982 is not exceptional. For, the figure 1 suggests, that there is simply a return to the old growth path. However, the package of reforms since 1982 did change the economic structure. This is apparent from the figure 2, which shows the number of jobs per inhabitant (source: GGDC). In this indicator the German curve is a good reference, because it is fairly constant, despite a small growth due to the German unification in 1990. The readers may see, that since 1985 the Dutch participation on the labour market increases for a long time. A previous column has shown, that this rise partly results from an increased participation of women in the labour process. Therefore many of the new jobs have a parttime character.
Besides the inflow of women, the economic growth contributes to the increasing degree of participation in the Netherlands (see the figure 1). However, the comparison with other states shows, that there the participation is less stimulated by the economic growth. Apparently, the Dutch reforms and the new economic institutions do matter for success. Conversely, the figure 2 shows, that the Scandinavian model fails after 1991, and the traditionally high participation does not recover. This model disappoints, at least in Sweden. It is also worth noting, that apparently the British recession in 1992 has clear negative and lasting consequences for the participation.
The figure 2 shows, that until the seventies the Dutch participation is lower than in the neighbouring states. But thanks to the reforms the Netherlands starts to outdo them during the period of the Purple cabinets. The figure 3 presents an additional reason for this. It shows how much the states spend on benefits for the disabled (source: OECD). Until 1994 the Dutch expenditures are larger than those of the other states. Around 1990, the Dutch situation is dramatic: the percentage of the disabled is about twice the percentage in other states6. In this year the prime minister Lubbers must conclude: "The Netherlands is sick". A previous column has concluded, that under the the direction of the social partners these benefits have been abused on a large scale. Especially the older workers are dumped in the arrangement for the disabled.
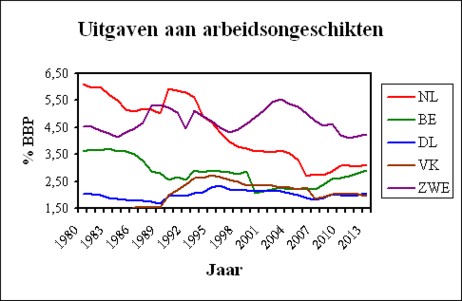
However, the cabinet Lubbers 3 reforms the transfer system for the sick and disabled. First, the level of the benefits is reduced. This measure moderates the income. Under the Purple cabinets, higher thresholds are installed for the access. The measures not only diminish the unfounded claims, but they also remove an incentive to remain passive. It is also worth noting, that the figure 3 is partly determined by the form of the national institutions, and therefore can present an overly negative picture of the Dutch treatment of older workers. The other states do not necessarily have better morals than the Netherlands. For instance, Germany has prematurely retired many of the superfluous older workers. It is true that this is not an abuse of facilities, but nevertheless it is yet the discarding of productive people.
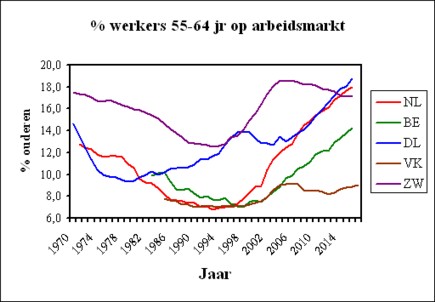
The treatment of older workers is again analyzed in the figure 4. It shows the share of male workers in the age category of 55-64 on the labour market (source: OECD). It turns out that originally the participation decreases, despite the emerging aging of the population. But around 1995 the tide turns, and the states establish institutions, which further the working at a higher age. The regulations for premature retirement become more sober, and the age for retirement is even increased. Also, a moral break is propagated, where enterprises are incited to value the input of older workers more. The Netherlands does not excel in this international trend, but it does enthusiasticly join it.
The previous figures sketch a rosy picture of the Dutch reforms: they have yielded more paid jobs for the citizens, and they have put back the growth of the welfare on a high level. However, the reforms have also caused effects, which preferably had to be avoided. This is visible in the figure 5, which shows the labour productivity (in short ap) per worked hour. Here the Belgian curve is a good reference. It is immediately clear, that the Dutch ap belongs to the highest in Europe. But after 1980 the Dutch ap grows less fast than those of the other European states. It grows approximately as fast as those of Germany, which since 1990 suffers from the poor labour morals in the area of the former GDR. A moderate growth of the ap is necessarily accompanied by a moderate rise of the wage level. In this manner, the Dutch welfare could be affected in the long run.
The decreasing growth of the labour productivity is caused by the new employment, which is created mainly in the service sectors. It is difficult to make the supply of services more efficient, and to thus improve their ap. Consider health care, or the restaurant and catering industry7. Those who want to rapidly increase the labour productivity, do well to create jobs in the industry. For, thanks to the technological progress in the industry more and more production processes can be computerized. But this also creates some problems. First, the computerization finally leads to an almost jobless growth. Second, increasing investments affects the wage fund, because they must both be paid from the national income. The workers forgo consumption in the short term, in order to consume more in the long run. See the columns about the three-sector model of the Russian economist Feldman8.
Nevertheless, it is conceivable that at present the Netherlands does not invest sufficiently, in comparison with other European states. Then the ap could stagnate. Therefore it is interesting to study how the investments develop. The figure 6 shows the investment quote, namely the share of the investments in the national income (source: the Worldbank, which calls it gross fixed capital formation, in short GFCF). First it must be remarked, that the GFCF is a package of various capital goods, including infrastructure, real estate, and even stocks9. Between 1970 and 1985 the GFCF decreases everywhere in Europe, because the economic structure transforms, where the industry becomes relatively less important. The citizens spend a larger part of their income on services, which are consumed directly. It is clear, that the relative decrease of the investments in the Netherlands is not exceptional for Europe10.
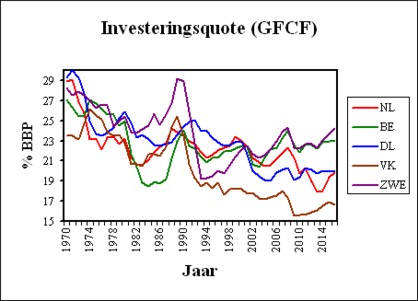
After 1985 the GFCF stabilizes somewhat everywhere, although significant differences appear between the various states. For instance, in the Netherlands the building trade shrinks after 2008, because the prices of houses diminish. In the British and Swedish growth paths the figure 6 clearly shows the recession of 1991 and beyond11. Incidentally, the transformation to a structurally lower investment quote (GFCF) must not be interpreted as a neglect of the productive branches. Namely, first, an increasing part of the national income is invested outside of Europe, where the profits on capital are higher. But such investments do not contribute to the national GDP, and they do not raise the domestic ap. They hurt the wage sum, but on the other hand create additional income from capital, which can be used to pay for instance pensions and insurance payments.
Second, the West-European states develop into knowledge economies, were the investments are mainly in human capital. This is evidently not included in the GFCF (only fixed capital). It is the counterpart of the first factor. For, since now the European industries suffer from the global competition, higher profits must be realized by supplying highly valued services. Each economic structure requires its own typical level of investments in capital goods. As a third factor it is sometimes mentioned, that nowadays the enterprises more often rent capital goods instead of buying them. Your columnist accepts this argument without reflection. Perhaps this allows to use the stock of capital goods in a more effective manner. All in all, the flattening of the European labour productivity seems to be inevitable12.
Nonetheless, each state can have some control by means of smart policies. For instance, the state can stimulate industrial innovation. And unfair competition can be blocked, for instance from states, which allow child labour and other forms of exploitation. Also, environmental norms can be imposed on import goods of states with a reputation of ignoring contamination. Here is must be immediately mentioned, that such arguments are sometimes abused by domestic interest groups, which want to protect their own production against foreign competition. Then one has rent seeking, because the product prices are unnecessarily high.
The conclusion of the present paragraph is, that the Dutch package of reforms since 1982 indeed has improved the domestic economy (and the welfare of the citizens). The affection of the labour productivity remains a point of concern. The Netherlands must always be alert that its innovative power is reinforced, when possible in the industry, which promices huge gains. This empirical analysis has undoubtedly made the reader curious about the package of reforms under the cabinets Lubbers and Kok. Also, the question rises, why nevertheless the policy of the Purple cabinets was criticized by the CDA politician J.P. Balkenende and, in more fierce words, by the writer and advisor W.S.P. Fortuyn. This all will be elaborated in a future column.