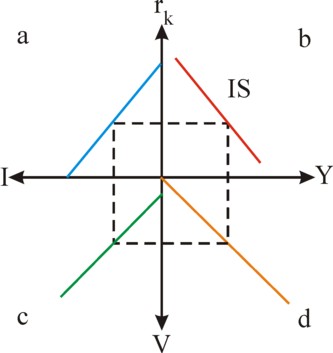
Figure 1: IS-cross with Y, rk, I and V
This column presents the well-known IS/LM model, that tries to explain the interaction between the commodity market and the money market. The commodity market is dominated by the investment function. On the money market especially the speculation is relevant. The two markets affect each other by means of the rate of interest. Some believe that the IS/LM model is a synthesis of the neoclassical paradigm and the theory of Keynes, but this opinion does not do justice to the large differences between both paradigms.
The following text is an almost literal copy of the paragraph 12.7 in the provisional reader Vooruitgang der economische wetenschap, which your columnist issued in 2011 with the publisher E. de Bibelude, a part of the Sociaal Consultatiekantoor. The reader is meant to be an introduction, and that is certainly true for this monetary part, which is superficial in substance - and thus hopefully easy to read. In the preceding column the fundamental concepts with regard to money and capital have already been defined. In a future column the IS/LM model will be refined further.
In the Kaleckian-Keynesian theory the investments are essential in order to keep the national income Y at the desired level. The producers and the state pay the investments mostly by means of loans, and must pay an interest as a compensation for the use of the capital. It is commonly assumed, that the height of the rate of interest rk is hardly important for the decision to borrow capital. The banks are usually willing to create the money, that is required for the expansion, without adapting the rate of interest. This idea is a hallmark of the Kaleckian-Keynesian theory, and leads to a controversy with the neoclassical theory and with the monetarists.
For, in the neoclassical theory the interest is simply the price of the money capital, and the producers will weigh its height just like they do for any other costs in the production process. Reversely, the propensity to save of the households will always increase, as soon as the rate of interest is raised. In a previous column it has already been remarked, that the economist Keynes was formed in the neoclassical tradition, and therefore attached some meaning to the interest in the formulation of his theory. This distinguishes him from his congenials in the economics of dynamic processes, such as Kalecki and the post-keynesians.
The rupture of Keynes with the monetarism is expressed by his denial of the necessity of the equilibrium S=I between the savings and the investments (at least with regard to the short term). The economists J.R. Hicks and A.H. Hansen have built on the interest-model of Keynes, and developed it into the IS/LM model. It illustrates how the themes concerning money and capital, which have been discussed in the previous column, can be integrated in the economic theory. Therefore the IS/LM model is sometimes called the synthesis of the Kaleckian-Keynesian theory and monetarism. Since the IS/LM model has been developed for the description of short-term phenomena, the prices are kept constant in all derivations.
The IS/LM model actually consists of two parts, namely the IS part with regard to the real economy of the commodity production, and the LM part with regard to the monetary policy. The rate of interest connects the commodity sphere of the IS part with the money sphere of the LM part, and brings about the stability of the economy. In this column the parts are first discussed separately1. For the sake of convenience, the state and the international trade are ignored in the discussion. However, they can be included in the model without fundamental difficulties. The IS part of the commodity sphere begins with the consumption function
(1) C = c × Y + Co
In the formula 1 the constants c and Co are respectively the consumption quote and the autonomous consumption. The formula 1 can be rewritten so that the savings function S=Y–C is obtained:
(2) S = (1 – c) × Y – Co = s × Y – Co
Here s is the savings quote. The investments I are now explicitely dependent on the rate of interest rk. Since the investments are often paid with borrowed money, where the interest adds to the costs, I(rk) is a decreasing function of rk. Here the investment function is modelled by means of the formula
(3) I = Io − i × rk
In the formula 3 Io is the autonomous investment, and i is a constant. Incidentally, the argument of the IS/LM model does not depend in a critical manner on the precise form of the investment function2. The figure 1 illustrates the functional dependencies. She shows the national income Y, the profit rate rk, the investment I and the real demand V as a cross with graphs in each of the four quadrants. In the cross the graph in the quadrant a represents the linear investment function. The remainder of the figure 1 will be explained in the following text.
An equilibrium is formed, when the following condition is satisfied
(4) S = I
When the formulas 2 and 3 are inserted in the formula 4, then one finds for the national income
(5) Y = (Io + Co − i × rk) / s
and for the rate of interest rk the inverse formula
(6) rk = (Io + Co − s × Y) / i
The formula 4 shows that now the condition for equilibrium does not prescribe a unique height of the national income. Depending on the rate of interest various values of Y(rk) are possible, where Y decreases for an increasing value of rk. This is logical, for then the investments I(rk) also decrease. The formula 6 is called the IS curve. The slope of the IS curve is -s/i, and she determines the sensitivity of Y for a changing rate of interest. According as s/i falls, and thus the curve becomes flatter, Y(rk) reacts more vehemently on changes in rk.
The IS curve can also be constructed in a graphical manner. This is done in the cross of the figure 1, resulting in the curve in the graph in the quadrant b. The method is as follows: for each value of rk the corresponding value of Y(rk) can be found by following the path a-c-d-b. On this path the graph in the quadrant c is simply the relation v=C+I from the column about the Harrod-Domar model. And the graph in the quadrant c is simply the relation Y=V, which is also copied from the mentioned column. For, in a situation of equilibrium the national income Y must equal the effective demand V of the population. Thus one finds finally the wanted value Y(rk) as the intersection of the dashed rectangle and the Y-axis in the quadrant b.
The LM part is discussed here for the first time on the webportal. It describes how the demand and the supply of money equilibrate, and for this purpose uses the concepts, that have been developed by Keynes in his General theory. In the column about money a reference is made to the money demand due to the precaution- and speculation-motive. There it is argued, that the demand function of money can be separated in two parts:
(7) L = Lt + Ls
Lt is the transaction part of the money demand, and results from the payments, that must be made during all kinds of transactions. According to the Verkehrsgleichung P×T = M×U, more money M is needed for the completion of the transactions T, according as T will rise. An increasing number of transactions implies, that the national income has grown. So the transaction part of the demand behaves as Lt = α×Y.
The other part Ls describes the money demand, which emerges from the speculation cashes. The investors keep liquid means in order to allow for possible investments in activities with a high capital efficiency3. According as the rate of interest rises, the investors will be less willing to keep their money liquid. The chance of a lucky shot does not compensate the lost interest. This speculative behaviour is described by the equation Ls = Lo – β × rk. After the insertion of the forms of the transaction- and speculation-demand in the formula 7 one has4
(8) L = α × Y + Lo − β × rk
The two forms of the money demand compete for the available supply of money. When L remains unchanged, and the rate of interest rises, then Y will be pushed upwards. The money flows from the speculation cash into the transaction cash. The households will prefer to spend their money on products instead of temporarily keeping it5. Then the circulation velocity U of the money must increase, that is to say, rk influences U. The dependency of the money demand on rk is shown in the graph in the quadrant a of the cross in the figure 2. The depicted relation supposes that Y remains unchanged. The demand curves for the other Y-values are parallel to the drawn curve.
The supply function of money is given by the equation
(9) M = Mo
Here Mo is the quantity of money, that is maintained by the Central Bank in the manner, as is described in the column about the money- and capital-markets6. The condition of equilibrium for the quantity of money is
(10) L = M
The figure 2 shows this equilibrium relation by the graph in the quadrant c. When the formulas 8 and 9 are inserted in the formula 10, then one finds for the national income the formula
(11) Y = (Mo − Lo + β × rk) / α
and for the rate of interest the inverse formula
(12) rk = (α × Y − Mo + Lo) / β
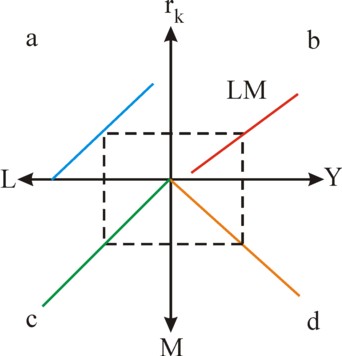
The formula 11 is called the LM-curve. She can be constructed graphically by means of the cross in the figure 2. In the graph in the quadrant b, for each value of rk the corresponding value of Y(rk) can be found by following the path a-c-d-b. Here the graph in the quadrant d represents a variant of the Verkehrsgleichung, namely M = Y/U. This depicted relation holds for the rk, which is chosen as the starting point of the construction procedure of Y(rk). That is to say, the cobwebb is followed for a certain value of rk, so that U is also determined uniquely. Finally one finds Y(rk) as the intersection of the dotted rectangle and the Y-axis, so that the construction of this point on the LM-curve is completed. The other points are found in the same manner.
Note that the condition of equilibrium in the formula 12 can only be satisfied, as long as one has Mo > Lo. For, with rk=0 Y will still be positive. The money quantity must be larger than the maximal demand for the speculation cash. A limit also occurs for a very large rate of interest. Namely, the speculation part of the money demand equals Ls = M – Lt = Mo – α×Y. The money demand can not be negative, because then the speculators would be suppliers of money. That is not possible, because only the banks can create money. Therefore one always has Ls≥0, and so Y ≤ Mo/α.
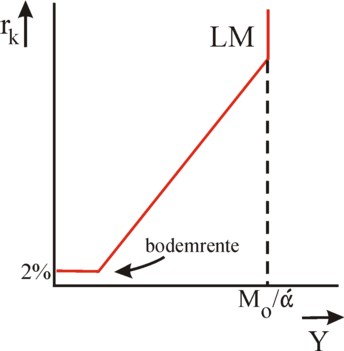
A national income of Mo/α implies that all speculation cashes will be empty, and the whole money quantity Mo is used for transactions. The Verkehrsgleichung shows, that then the maximal growth is reached, at least as long as the price level P does not fall or the circulation velocity U does not rise further. The circulation velocity has reached its natural maximum, because all the passive money in the cashes has been pulled out.
Note furthermore, that according to the formula 12 the interest becomes negative for low national incomes. This is an imperfection of the used function for the interest rate. A very low interest rate will actually raise the expectation with the investors, that she can only rise in the future. In this situation the investors will have an almost unlimited demand of money, because they expect to be able to invest the money in the future against a higher rate of interest. Therefore the rate of interest can commonly not fall below a margin of approximately 0% to 2%. This is called the bottom interest.
If the central bank would increase the money quantity Mo in this situation, then it will be hoarded immediately by the investors. Keynes calls this the liquidity trap. The extra money does not become available for the expansion of the number of transactions, so that the national income remains at its low level7. The figure 3 shows the LM curve, including the bottom interest and the empty speculation cashes at high rates of interest8.
At the beginning of this column it has been stated, that the real and monetary sphere mutually interact9. Both spheres are connected by means of the rate of interest, which realizes the equilibrium condition YIS = YLM. Thanks to the formula 5 and 11 it is always possible to calculate the rate of interest for this equilibrium condition:
(13) rk,e = ((Io + Co)/s − (Mo − Lo)/α) / (i/s + β/α)
It has already been noted, that due to the chosen form of the demand- and supply-functions the validity of the interest-formula 13 is restricted to the range of rates of interest between 0.02 and Lo/β. The national income Y(rk,e) in the state of equilibrium equals
(14) Y = ((Io + Co )/i + (Mo − Lo)/β) / (s/i + α/β)
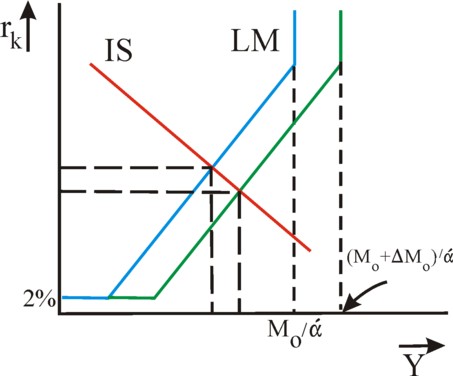
The formulas 13 and 14 give insight into the way, in which the equilibrium shifts due to a change in the autonomous variables or the constant quotes. Incidentally, the dependencies can also be depicted visually by drawing the formulas 6 and 12 together in a Y - rk cross of axes. This is done in the figure 4. In particular, it becomes clear from the formula 14, that the Central Bank can increase the national income by making more money Mo available. Then in the figure 4 the LM-curve shifts downward and to the right. The income will rise, and the rate of interest will fall. In this policy the growth is probably reinforced, because the producers are incited to increase their autonomous investments Io. In that situation the rise of the investment level would result in a fairly constant rate of interest, in spite of the larger quantity of money.
When the IS/LM model is extended with the state sector, then a planned policy is possible, which uses the increase of the quantity of money as a support for expansive investments by the state. Then the state can stimulate the economy, without the risk that all the available money is hoarded. This is called an accomodating policy of the Central Bank. A detailed discussion of this theme is beyond the scope of the column. However, in the column about money it has already become apparent, that the monetarists reject the accomodation.
The term Io + Co in the formula 14 has evidently a Kaleckian-Keynesian origin, whereas in the term Mo − Lo the monetarism of the formula Y = ν × M can be recognized. The last term has an extra multiplier i/β, in comparison with the first term. If the multiplier would be much less than 1, then the post-keynesians would be right. Unfortunately it is not possible to measure its value in an empirical manner. It is actually uncertain, that for instance the LM-curve really has the shape of the figure 3. It is conceivable, that the parameters α and β themselves depend somewhat on Y. Then the LM curve can be a curved curve, such as in the figure 5, instead of a straight line. Indeed the curve is depicted in this alternative manner in many textbooks10.
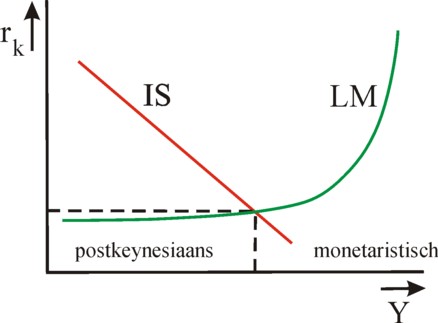
In the figure 5 two ranges of Y-values can be distinguished. For the lower national incomes the LM curve is almost horizontal, with as a consequence that the investments can be increased without raising the rate of interest rk. That is to say, during a shift of the IS-curve to the right rk in the intersection with the LM-curve hardly rises. Apparently, in this range of Y-values the economy behaves in a post-keynesian manner. Note also, that a (not too large) change of the money quantity M hardly influences the national income Y, because the intersection remains at almost the same place.
On the other hand, for larger national incomes the LM-curve exhibits a steep increase. Now the shift of the LM curve due to a changing money quantity M has a much more drastic effect, wherein both Y and rk must adapt. Apparently, this range of Y-values belongs to an economy with monetaristic characteristics. Now, an increase of the investments will indeed hardly yield a larger national income. The steep LM curve keeps U almost equal (but not the rate of interest!). In the paragraph about the monetary sphere it has already been explained, that here the speculation cashes are almost empty.
Apparently, the controversy between the monetarists and the post-keynesians reflects the absolute validity of each of these theories within a certain range. Between these two ranges the economy is in a state, where both the expenditures and the money quantity exert an influence. This could be called the synthesis of the two theories, but that is not entirely justified. For, the controversy concerns the question, what range is normal for the real economy11. Additional remarks can be made about the IS/LM model. For instance, the price behaviour is not considered. In a following column the model will be refined, and a judgement will be given concerning its credibility.