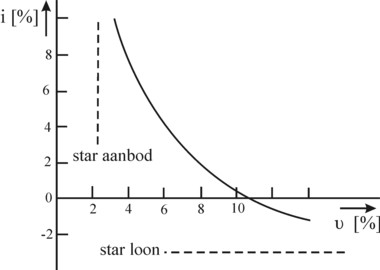
Figure 1: Phillips curve
For years the IS-Lm model was popular. However, it has the disadvantage, that the price inflation is not taken into account. Namely, the model assumes a constant price level. In order to understand inflation, it is useful to study the so-called Phillips curve. It turns out, that the unemployment must be kept at the NAIRU level. Thanks to such insights the IS-LM model can be transformed into the superior AS-AS model. Nowadays the AS-AD model has again become obsolete due to its serious faults.
In a preceding column the IS-LM model has been explained. This model has been developed thanks to various famous economists, and it obtained its final form in the sixties of the last century. It is an attempt to gain insight into the interaction between the production at the macro level and the monetary sphere. The coordination between those spheres is supposed to be provided for by the rate of interest rk. The model assumes that the economic system is in a state of equilibrium. In the mentioned column the condition for equilibrium has been derived:
(1) Y = ((Io + Co )/i + (Mo − Lo)/β) / (s/i + α/β)
In the formula 1 Y is the national income. The parameters Co, Lo, s, i, α and β are system constants. In the ideal situation Y has a size, that exactly allows for the use of all available production factors. Then the production capacity is completely used. In particular, there is a full employment. When Y is lower than the ideal value, then the formula 1 shows how the situation can be improved. Namely, the Central Bank can increase the money quantity Mo. Or the state can increase the investments Io by means of state investments. Thus man would finally control the fluctuations and uncertainties of the economic sphere.
A special hallmark of the IS-LM model is, that it assumes a stable price level P. In the seventies of the previous century the inflation increased to such an extent, that the assumption of a constant P was no longer tenable. Then the economists have tried to integrate the consequences of inflation into the IS-LM model. That attempt has resulted in the so-called AS-AD model. It is true that this model can not describe the inflation itself, but it does illustrate the changes that have occurred in the economic system, as soon as a new price level is reached. In this view the period of inflation is merely an intermezzo between two states with a stable price level.
The present column first explains, how the inflation affects the unemployment and thus the national income Y. Next the IS-LM model is used to construct the AS-AD model. The contents of the column follows broadly the argument in the paragraph 12.8 of the provisional reader Vooruitgang der economische wetenschap, which your columnist issued in 2011 at the publishing business E. de Bibelude, a part of the Sociaal Consultatiekantoor. However, the text has been thoroughly revised, notably to make clear whey the present economists again reject the IS-LM model and the AS-AD model, with the exception of orthodox (or lazy) dogmatists. The revision underlines in an impressive manner, that in the study of society one must never confide in just a single source1.
Many columns on this portal refer to the price level P. Most textbooks present an abstract definition of the price level. It is for instance defined as the price per unit of the national product, or the average price of a transaction. The inverse 1/P represents the value of money. The inflation π is the rise of the price level, and therefore equals the loss of money value. In this column inflation is defined as the decrease in value (as a percentage) within a certain time interval, for instance a year (some textbooks call this the rate of inflation)2. In a mathematical form this is π = (∂P/∂t) / P. Inflation causes the problem, that the money is less well suited for executing its four functions (exchange, measure, accumulate, remit). For, the uncertainty increases, especially with regard to the spending power of money. But in addition the relative price ratios become unpredictable, because each product has its proper price development3.
It has been shown empirically, by means of statistical data, that the price stability and employment are difficult to reconcile. This analysis resulted in the so-called Phillips curve. Although the curve is empirical, she has some theoretical logic. The Phillips curve is often presented in its mathematical form, where she describes the direct relation between the inflation and the employment uw (as a percentage of the working population). That results in
(2) π(t) = πo + α × (uw(t) − uwo)
In the formula 2, π(t) and uw(t) are respectively the inflation and the employment at the time t. The parameter α is constant and positive, and πo and uwo refer to the values under "normal" or "natural" conditions. The figure 1 presents the Phillips curve in a graphical manner. The variable ν along the horizontal axis is the fraction of the working population, which is unemployed, that is to say 1–uw.
Note that uw correlates positively with the national income Y. Therefore in the right-hand side of the formula 2 uw can be replaced by Y(t), if desired, and perhaps with a slightly different value of α. Then the income Yo guarantees the "natural" level of employment. As long as Yo is maintained, π(t) will also remain constant. The corresponding νo = 1 − uwo is called the non-accelerating inflation rate of unemployment (in short NAIRU). For the sake of convenience many textbooks assume, that at the NAIRU the inflation is absent, in other words, one has π=0. The term "natural" exclusively refers to the stability of money. It must be distinguished from the term "natural employment", which refers to the imperfections and frictions on the labour market4.
The relation between the price-inflation π and possible rises in the wage level is given by the formula5
(3) π(t) = (∂w/∂t) / w − (∂(ap)/∂t) / (ap) + πw
In the formula 3, w is the nominal wage level, and (ap) is the real productivity of labour. The term πw explains the importance of the NAIRU. For, when the workers expect a future price inflation πw, then they will include her in their wage demands as a so-called price compensation. Subsequently their expectation is fulfilled automatically, even when the nominal wage would rise as much as the productivity. When the workers sustain this illusion of a rising inflation, then they cause an upward price spiral. It is the duty of the state to prevent, that the workers adopt this price illusion. For that purpose the state can stabilize the unemployment at the NAIRU. Unfortunately, the NAIRU can not be measured empirically, among others because she is affected by all kinds of stuctural changes of the economic system.
The national income can be divided in various sources:6
(4) Y = w × L + i × K + Ψ
The formula 4 contains the nominal variables. The real variables are obtained by dividing the formula on the left- and right-hand sides by P. In the formula L represents the number of working-hours, i is the nominal rate of interest, and Ψ is the profit of the enterprises. Suppose that the real national income is stable, then the formula 4 clearly displays a number of sources of price inflation. Unfortunately it is hardly possible to determine empirically the dominant sources of the inflation. Thus the identification of the causes of inflation becomes mainly a matter of political conviction. Indeed the various economic currents each has its own explanation for the occurrence of inflation:
The figure 1 is suited well for the illustration of the occurrence of the inflation both by demand pull and cost push9. Demand pull is a situation, where there is an almost complete employment. The production capacity is almost completely occupied, so that a further expansion requires expensive makeshifts, such as overtime. This causes high wages and the product supply remains behind the demand. Then the Phillips curve looks like a vetical line10. Cost push is the situation, where the production factors (notably the workers) succeed in securing their purchasing power. Thus the profit marge can not improve, and the entrepreneurs will start lay-offs. In this situation the Phillips curve resembles a horizontal line.
At the same time your columnist asks the reader to be distrusting with respect to such interpretations. For instance, the adherents of the neoclassical paradigm and of the monetary paradigm are inclined to use the vertical Phillips curve for statements about the long term. Extra investments by the state would merely cause inflation. In reality such investments naturally increase the production capacity, so that the price level will stabilize in the long term11. The policy choices to combat the inflation will thus be different, depending on the economic ideology, that one supports12.
The inflation problem has received new attention since the seventies of the last century, because then a long period of stagflation occurred. This is the combination of inflation and stagnation of the economic growth. At the time she caused despair among the economists, because on the one hand extra investments are needed in order to combat the stagnation, whereas on the other hand this would further raise the inflation. The single policy instrument can not solve the two policy goals (growth and price stability). Due to this impasse the interest in alternative economic theories has increased again, such as monetarism. Incidentally, then the cause of the inflation was mainly the rising price of oil, that is to say, she was imported13.
Although the post-keynesians point to the increased investments as the cause of inflation in the short term, yet the money-creating institutes are not entirely innocent. For, they enlarge the money quantity in proportion to the increased demand from the real economy. This policy, which intends to stabilize the rate of interest, for instance during a period of large state investments, is called accomodating14. So she is an accomplice in the overspending, but not its initiator.
The monetarists have a different view. They state, that the money-creating institutes have over-extended the money quantity on their own initiative. In a preceding column it has been explained, that the monetarists believe in a natural monetary equilibrium, due to the forces of demand and supply, which must not be affected by external interventions (by the state or the banks). This monetary idea can be translated into the so-called AD- and AS-curves, which are described in the following paragraphs.
In the IS/LM model the price level P is kept constant. That is to say, it is a model for the short term, when the prices are still rigid and do not adapt to possible changes. In this paragraph a study will be made concerning the manner, in which the price level depends on the total demand and the total supply of all products and services. The aim is to be able to make predictions about the economic developments in the long term. The total demand is abbreviated symbolically as AD (aggregate demand), and the total supply as AS (aggregate supply).
It can already be revealed now, that this study will lead to a familiar and apparently self-evident result, namely the well-known figure for the market equilibrium. However, such a picture of market-demand and -supply concerns the price formation of products at the micro-economic level, whereas the AD and AS curves want to describe the influence of the general price level at the macro-economic level. The derivation of the AD curve will be coupled to the IS and LM curves. Moreover, some criticism will be expressed about the obtained results.
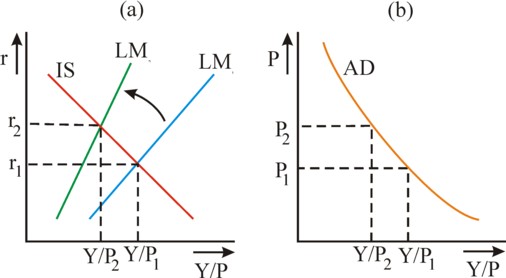
Now the macro-economic demand side will be considered first. In the IS/LM model the national income Y is commonly presented along the horizontal coordinate axis. Since the national income is a nominal variable, which itself depends on the price level, it is not a sound measure for the study of the effects of price changes. A variable is required, which represents the real production. Therefore in the pictures of the market equilibrium and the market-clearing (in the de planned economy as well) the total nominal yield is not presented along the horizontal axis, but the total production Q is preferred, which actually simply equals the real national income. In other words, the horizontal measure must be based on the quantity of circulating physical products. In the present paragraph that is the real GDP, or Y/P. In the figure 2a the IS/LM model is shown again, but now with Y/P along the horizontal axis.
Then the AD curve is constructed in the following manner. Suppose that the price level originally equals P1, and at a certain moment the prices increase, so that the price level rises to P2. Then for a constant nominal money quantity Mo less transactions can be completed. Apparently the balance of real money has been reduced, with as a consequence that the LM curve shifts upwards and to the left. This is also visible in the formula of the LM curve:
(5) rk = P × (Y/P) × α/β − (Mo − Lo) / β
Apparently the equilibrium for P2 (the intersection of the IS- and the new LM-curve) is characterized by a lower Y/P and a higher rate of interest rk. The states of equilibrium [(Y/P)1, P1] and [(Y/P)2, P2] are both on the AD curve, and can be drawn in the figure 2b. This procedure can be repeated for all price levels Pj, and then one finds the AD curve displayed in the figure 2b.
Another way to explain this AD curve is to apply the Verkehrsgleichung (Fisher equation)15. She can be rewritten as P = M × U / (Y/P), which shows that P decreases for an increasing Y/P. This derivation of P(Y/P) seems to be self-evident. Note however, that the circulation velocity U of money depends on the rate of interest rk. Usually an increase of Y/P will be accompanied in some way by a change of the rate of interest. Therefore P does not depend on Y/P according to a simple inverse relation.
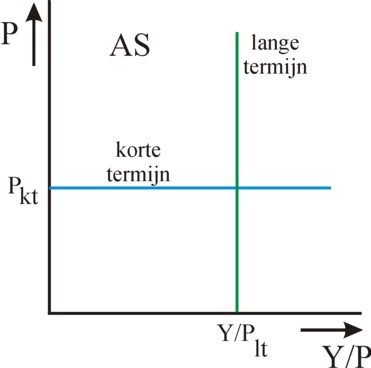
The AS curve for the relation between the price level and the aggregate supply has a shape, which depends strongly on the time scale, that is considered. On the one hand, in the very short term the price level P does not have the time to adapt to the economic changes, and remains constant. Sales are at the same price, irrespective of the decrease or increase of Y/P. Here the AS curve is a horizontal line. On the other hand, in the very long term all available production factors L and K can be employed, so that Y/P = F(L,K) is constant. In this situation the real size of the economy does not depend on the price level P, which (according to the Verkehrsgleichung) is determined only by the money quantity M. Now the AS curve is a vertical line. Both AS curves, for the short and long term, are depicted in the figure 3.
The AS curves in the figure 3 are extremes. A more common AS curve can be derived by using the neoclassical theory, notably the concept of the decreasing marginal utility. However, now it is assumed, that the price level P changes, whereas for the time being the nominal wage W remains fixed16. The figure 4 presents the argument graphically, in the form of a cross of axes. The starting point is the graph 4 in the quadrant a, where the relation between the real wage W/P and the price level P is shown for a constant nominal wage W. Starting from this graph, for each P the corresponding Y/P can be derived, by following the dotted path a-c-d-b along the graphs. First, in the graph in the quadrant c the decreasing marginal product is copied. This is also the demand curve for labour, because the workers receive a real wage, that precisely matches their marginal product.
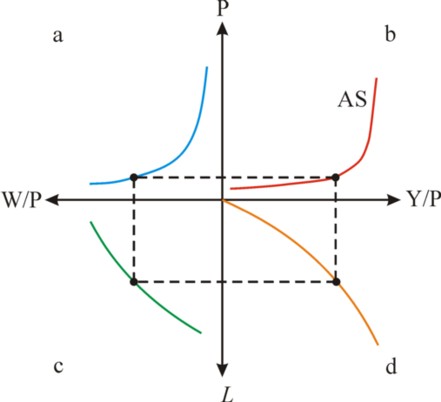
The graph in the quadrant d is the most important one along the dotted path. She depicts a production function, for instance the Cobb-Douglas function. Such a function has the form F(L, K) = A × Lα × K1-α, with α<1. Merely the rather short term developments are considered, so that the stock K of capital goods is still constant. Then, during a growth of the number of workers L the growth of Y/P is slowed down, due to the less favourable ratio L/K and the accompanying decreasing marginal product of the labour L. In other words, one has Δ(Y/P)/ΔL = α × (Y/P) / L, so that the growth rates have the relation gY/P = α×gL, which is unfavourable for Y/P.
The decreasing growth gY/P can also be explained by the capacity utilization uk of the capital goods. According as the number of transactions rises, the utilization will increase, until all production facilities are employed completely. Any additional workers can not obtain a place in the production process and will be unproductive.
Finally, the intersection of the dotted path and the (Y/P)-axis gives the real GDP Y/P, which corresponds to the price level P. Thus the point [(Y/P), P] on the AS-curve has been determined. This procedure can be repeated, until all points on the AS-curve are found. The constructed AS-curve illustrates, that the price level will rise due to an increasing real GDP. Note, that this curve is similar to the total costs curve. Indeed the sales price is simply the cost price, augmented with a markup factor.
The mathematical explanation of the AS curve is also worth a consideration. She is presented by the formula17
(6) P(t) = Po + α × (Y(t) − Yo) / Yo
The parameter α is constant and positive. The formula 6 is a compromise between the two lines in the figure 3. The similarity with the formula 2 is striking. Note that π(t) can be made discrete in the form (P(t) − Po) / Po. When this is inserted in the formula 2, then she will indeed assume the form of the formula 618.
The AS curve is a convenient theoretical instrument. For instance, thanks to the relation between the real GDP and the utilization u she gives an insight in the development of business cycles. During the recession the economy suffers from an under-utilization, and the number of transactions is relatively low. According to the AS curve the corresponding price level will be low. During the prosperity phase of the cycle u, Y/P and P will increase. When finally all production capacity is occupied, Y/P will no longer increase. In that situation the extra expenditures merely cause inflation. This is the situation of an economic overheating, and the start of the crisis.
Finally the AD- and AS-curves can be drawn in the same [(Y/P), P] figure, and then one finds the point of equilibrium in the intersection of both curves. Thus the price level is interpreted as an indicator of the scarcity due to the size of the national product. The reader may remember the opinion of the monetarists: when the state or the banks would use the money quantity for an intervention in the price level, then demand and supply would no longer be equilibrated. Then the households would be forced to keep too large money cashes.
On the other hand the post-keyesian economists reject this opinion. Namely, a change in the price level is primarily caused by the changes of the incomes, and not by the changes of the product supply. If there is no intervention, then the changed incomes threaten to affect the prices. Apparently the price level is floating and unstable, because the investments in the production vary. Since the changes in the price level are confusing, the state and the Central Bank must engage in an active policy so that the money quantity follows the incomes in the production, in order to stabilize the price level19.
For several decades the IS/LM model was accepted by the mainstream of the economic science. Later the need emerged to transform it into the AS/AD model. But nowadays both models are considered to be obsolete. For instance, the famous economist J.E. Stiglitz has barred the IS/LM model from his textbook. The well-known German economist P. Bofinger does include both models in his textbook, but remarks that they belong in a museum. There are two categories of criticism. The first category states, that the IS/LM model (and thus also the AS/AD model) contradicts the theory of Keynes. Here the controversy originates from the choice of paradigm. The second category believes, that the IS/LM model and the AS/AD model are truly faulty, and thus must be fundamentally rejected.
Among the opponents in the first category is the famous Italian economist Pasinetti. He points out, that the Kaleckian-Keynesian theory in the IS/LM model is furtively again reduced to a simultaneous equilibrium on the various markets20. In accordance with the neoclassical theory the rate of interest plays the role of the price of capital, which allows for the interaction of markets. This does not agree with the idea of Kalecki and Keynes, that the rate of interest is of minor importance in the productive sphere. Actually, they explain the origin of the national income Y without referring to rk. They also state, that in the monetary sphere rk is determined independently of the national income. Here Kalecki again has a standpoint of principle, whereas the theory of Keynes leaves some room for doubt.
Namely, Keynes does make an elaborate analysis of the function of interest. He assumes, that the causal relation is not two-sided, like in the IS/LM model, but works in a single direction. According to Keynes, the chain of cause and consequence is as follows: (1) the chain starts in the monetary sphere, where rk is determined by the money demand and the money quantity, (2) next a decision is made to invest I on the basis of rk and the expected capital efficiency, (3) so that the national income Y is generated, and (4) finally the expenditures C follow from the effective demand, via de consumption ratio. This implies that the various markets have a hierarchical order (capital market → market of investment goods → labour market)21.
For the second category of criticism your columnist consults several German books. They present a laundry list of objections against the models22. An objection is that the Central Bank is supposed to be able to directly affect the money quantity. But in reality the Central Bank commonly just controls the rate of interest. Furthermore, the IS/LM model only makes sense in combination with the AS/AD model, and the latter model has several serious drawbacks. The falling behaviour of the AD curve is strange, because then the economic growth would be accompanied by deflation (general decrease of prices). However, the deflation is generally considered to be hurtful for the economy, and not a sign of growth. Moreover, the falling behaviour of the AD curve implies, that in the case of a decreasing total demand (which shifts the AD curve to the left) deflation would occur. But in practice that phenomenon has never been observed.
The objections against the AS curve concern her neoclassical character. For instance, in the construction of the figure 4 a macro-economic marginal product of labour is used (see quadrant c) as well as a macro-economic production function (see quadrant d). The validity of these concepts for the macro-economy has been questioned many times on this portal, together with the concept of the aggregated capital. See for instance the column about the Solow model.
But also the vertical long-term AS curve in the figure 3 is unsound. For, in the long term the economic system is not static. It develops, so that the production capacity can increase. The statistical vertical AS curve leads to unreliable predictions. Thus after a collapsing demand AD the economy can supposedly recover completely simply by shifting the price level downwards. In this frame of thought it can not be explained, that the economic system can stagnate durably on a level with a high structural unemployment. Apparently all these faults hurt the credibility of the AS/AD model to such an extent, that the modern economists prefer to abandon it. This may be a warning to all those Dutch students, who still graduate with a rock-solid belief in the AS/AD model.