
Figure 1: Tinbergen Ecu
In many columns it has been explained how the Leninist planning agency chooses the optimal growth path, usually by means of intertwined matrices. The western economists commonly prefer to calculate the growth path by means of dynamic one-sector models. The present column describes an optimization model of the Dutch economist Jan Tinbergen, from his book Mathematical models of economic growth. The model is based on a utility function. Tinbergen concludes that such models can not determine the optimal growth, because as yet there is a lack of realistic utility functions.
So far, on this portal the necessity and the possibility of the macro-economic planning are regularly returning themes. The core of planning is formed by the valuation of the present consumption with respect to the future consumption. A technical solution does not exist for this problem, because the solidarity between the generations is essential for this choice. Economics can merely indicate what will be the consequences of the various policy options for the distribution of the consumption across the generations. It tries to keep out the value judgements from its models. The ethics and the morals are external factors for economics, which must preferably be introduced in the models in an abstract and general manner1.
On this portal the Leninist movement is represented by many texts of the East-German economist Eva Müller. She distinguishes between two types of dynamical models. First, there are the one-sector models, which are used to estimate the growth of the total product. Next, there are the many-sector models or intertwined balances, which can calculate the dynamic growth at the micro-level by means of linear programming.
Often Müller uses linear target functions in order to formulate the policy goals in a mathematical manner. This suggests unjustly, that the social needs can be represented by a sum of money. Müller is aware of this mistake, but she can not invent a better method. As an excuse the reader may consider, that in the early years of the Leninist planned economies the criteria were even more primitive2. Other Leninist have proposed non-linear target functions, which taken into account the true preferences of the planning agency. An interesting example of this category is the model of Val'tukh. However, the numerical computations with such improved models are quite complex, and they have never become a common practice.
In the western approach of economics the application of macro-economic, social target functions has never become popular. It is simply too ambitious. The famous Dutch economist Jan Tinbergen gives in his book Mathematical models of economic growth an interesting illustration of the obstacles, which hinder the application of target functions3. The present column repeats his arguments, with occasional supplements and comments. Tinbergen uses a one-sector model, just like Müller, although the linear target function is replaced by a more realistic version.
The target function of Tinbergen consists of the utility function of the central planning agency. It is obvious that Tinbergen assumes, that the central authority is legitimized by means of the democracy, so that the utility function represents at the same time the collective will of the people4. Just like the Russian economist Konstantin Val'tukh or the Czech economist Miroslav Toms, Tinbergen assumes, that the consumption C lies between a minimum value Cmin and a saturation value Cmax. The consumption is a function C(t) of the time t. Now suppose that the marginal utility of the consumption equals
(1) ∂U / ∂C = u = ((Cmax + Cmin − C) / (C − Cmin))ν
In the formula 1 ν is a model constant. The function u(C) is chosen in such a way, that she is infinite for C=Cmin. For, at this level of consumption the subsistence minimum is reached. The point of saturation, which is defined by u=0, has C = Cmax + Cmin. Furthermore, note that calculations with the marginal utility imply, that the utility scale is cardinal. This choice can be justified, though she is traditionally disapproved. Tinbergen concludes from the consumptive behaviour of the North-American and French workers, that the constant ν is approximately equal to 0.6 5.
Economists commonly mark down the future incomes by means of a discount factor, a certain percentage, with respect to the present. For, the present income can be used for saving, which yields interest as a future benefit. Tinbergen ignores this discount factor. The consequence is, that in a situation with a growing consumptive level C(t) the future generations can enjoy an ever increasing utility U(t). This may be just, or at least a submission to the course of life. The choice for a certain discount factor would be arbitrary6. Eva Müller often uses in her models a time horizon T, which amounts to an abrupt discount factor.
Furthermore, suppose that the size of the population remains constant. Then the number of workers remains constant as well, and therefore the factor labour disappears from the production function. The capital becomes the limiting factor for the production. In imitation of the Domar-Harrod model Tinbergen defines the constant
(2) κ = K / Y
In the formula 2, Y(t) is the national income, and K(t) is the stock of capital. The constant κ is called the capital coefficient, or in the English literature the capital-to-output ratio.
The national income is expended on the consumption C and stored as savings S. Suppose that the economy develops in equilibrium, so that all savings are invested. That is to say, S = I. Furthermore, note that one has I = ∂K / ∂t. The combination of these two formulas with the formula 2 leads to
(3) C + κ × ∂Y / ∂t = Y
The model of Tinbergen is interesting, because C(t) can be determined separately by means of the formula 1. Here Tinbergen invents an original argument, which illustrates his excellent economic insight. Namely, the planning agency aims to maximize the total utility of all generations. In formula this is
(4) find in the presented model the C(τ) that maximizes: Ω = ∫0∞ U(C(τ)) dτ
In the formula 4 the symbol ∞ represents positive infinity, so that the interests of all generations are included. According to the formula 4 the planned consumption C(τ) (with τ in the interval [0, ∞]) must be distributed over time in such a manner, that any deviation from the plan would lead to a decreased total utility. Consider for instance the consumption C(t) of the generation at the time t, and split the integral of the formula 4 into two parts
(5) Ω = ∫0t U(C(τ)) dτ + ∫t∞ U(C(τ)) dτ
The first integral measures the utility of the consumption for all generations before the generation t. The second integral measures the utility of the consumption for all generations after t. Since the total utility Ω is maximal in the optimal situation, the generation t can not realize a larger Ω with a small shift of the consumption. Thanks to this fact, C(t) can be calculated.
For instance, suppose that the generation t decides to give up one unit of consumption in order to realize extra savings. Then she can invest 1 unit extra, and this enlarges the stock K of capital for the following generations. The formula 2 shows, that thanks to the investment the national income Y of the generation t+1 has increased with an amount 1/κ. Although in the optimum the small shift of 1 consumptive unit does not change the total utility Ω of all generations together, of course the utility of each generation does change. The generation t loses 1 unit of consumption, and that costs a quantity u(C(t))×1 of utility.
When the generation t+1 completely consumes her extra income, then she gains a quantity u(C(t+1)) / κ of utility. Moreover, the extra unit of capital can also be used by all following generations, who thus also receive an additional income of 1/κ. Etcetera. Tinbergen concludes that the total gain of utility for the generations after t has a size of ∫t∞ u(C(τ)) dτ/κ. Due to the conservation of Ω the utility loss of the generation t and the utility gain of the following generations must compensate each other7:
(6) u(C(t)) = - ∫t∞ u(C(τ)) dτ/κ
The remainder of the argument is simple. Differentiate the formula 6 on both sides with respect to t, and insert ∂u/∂t = (∂u/∂C) × dC/dt. The result is
(7) κ × ∂u/∂C × dC/dt = - u
Next substitute u of the formula 1 in the formula 7. This leads to an equation for C(t), which has the solution:
(8) C(t) = Cmin + Cmax / (1 + B × e-t/(κ×ν))
In the formula 8, B is obviously an integration constant, which is fixed by the value of C(0). The consumption can never fall below Cmin, which acts as a threshold, as it were. It is convenient to equate Cmin in the mathemetical formulas to zero, so that henceforth C(t) represents the consumption above the subsistence level. In a similar way Y(t) is henceforth the income above the subsistence level.
Now that the optimal consumption has been fixed by the formula 8, the corresponding optimal national income can be found by substituting this C(t) into the formula 3. One finds8
(9) Y(t) = - (Cmax / κ) × ∫ e(t−τ)/κ / (1 + B × e- τ/(κ×ν)) dτ
Solving the formula 9 is not simple. It can be done when it is assumed that ν=½, which is indeed a fair approximation of the empirical value of 0.6. With this simplification Tinbergen gets the result9
(10) Y(t) = (Cmax / √B) × et/κ × arctan(e-t/κ × √B) + A
In the formula 10 A is an integration constant. Tinbergen wants to determine it by considering the situation t→∞. It is known from mathematics that limx→0 arctan(x) / x = 1. Then the formula 10 changes into Y(t→∞) = Cmax + A. According to the formula 1 (still with Cmin=0) one has u=0 for C=Cmax, and therefore this C is the point of saturation of needs. Tinbergen supposes, that finally for t→∞ the national income Y will have grown to such an extent, that the point of saturarion has indeed been reached. In that situation there is no longer any need to save or invest. Therefore one has Y=Cmax, with A=0. Now the optimal national income is completely fixed.
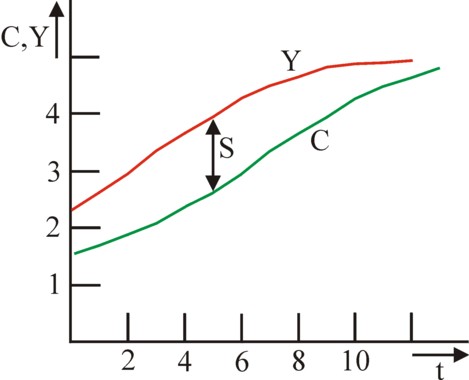
Tinbergen ends with an evaluation of his model. She turns out to be unsatisfactory. Thus Tinbergen concludes that the planning by means of target functions is of little use. His argument starts with the analysis of the relation between the consumption C and the national income Y. Suppose that ∂Y(t)/∂t is approximated by (Y(t) − Y(t-κ)) / κ. When this approximation is inserted into the formula 3, then it follows immediately that one has C(t) = Y(t-κ). That is to say, the consumption is identical to the national income, at the time κ before. The consumption C(t) and the national income Y(t) are shown in the figure 2. The savings S(t) form the vertical distance between these two curves. It is clear that for the optimal consumption the savings at the start must rise, and they must fall again for the distant future.
Interesting is also the exact calculation of the savings S(t). Define the savings quote as σ(t) = S(t) / Y(t). Introduce a temporary variable, namely θ(t) = e-t/κ × √B (see also the footnotes). Introduce again the threshold Cmin in the values C(t) and Y(t). For the sake of convenience define γ = Cmax/Cmin. Tinbergen derives by means of mathematics that one must have10
(11) σ(t) = 1 − (1 + γ / (1 + θ²)) / (1 + γ × arctan(θ) / θ)
Tinbergen has computed numerically, for several values of γ, the maximal possible savings quote σmax 11. His results are shown in the table 1. The reader sees the problem, that apparently extremely high savings quotes can occur in the optimization model. This is actually caused by the Leninist law of the accelerated growth of the production of the means of production (equipment). That is to say, later generations enjoy an optimal consumption, when the first generations are willing to invest all their incomes.
| γ | 10 | 100 | 500 |
| σmax | 0.63 | 0.86 | 0.94 |
In the western societies such high savings quotes are never realized. According to Tinbergen the average savings quote in the United States of America and in England is merely about 12% 12. Apparently the people are simply not willing to make such sacrifices for their (distant) offspring. In the Leninist states, where the planning agency did try, it lead to riots, inspite of the repressive regimes. In other words, the present generation demands that in the formula 4 a discount factor is applied to the utility U(C(τ)).
That discount factor reduces the utility for the future periods, where the national income and the consumption will attain higher values. It is obvious that the discount factor also influences the formula 1. It can not be excluded, that the height of the discount factor can be estimated by asking the people about their preferences. In this way they can express their solidarity with the future generations, which can not yet defend its own interests. But Tinbergen does not want to elaborate on this possibility, and ends his discussion with the conclusion, that economics can not determine the optimal growth. His optimization model is elegant, but for the time being it is merely an academic finger-exercise.