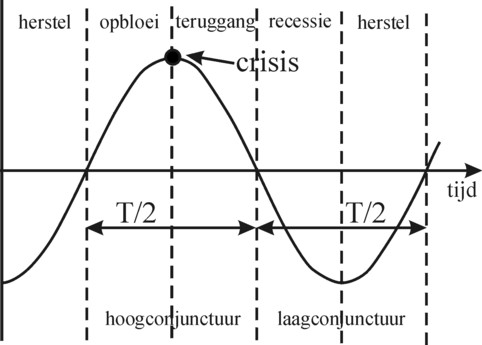
Figure 1: The business cycle as a sinus
This column summarizes the principles of business cycles. First, attention is paid to the form of the cycles, and to the division in four phases, namely recession (or depression), recovery, prosperity, and decay. The method of Wesley Mitchell is applied for ordering several statistical data. They are compared with the theory of business cycles according to De Wolff. And finally a short description is given of some other theories of business cycles, which suggest possible causes for the development of crises. The theme has gained in importance, since it has become clear that the global scarcity of resources allows for merely a selective growth.
The experience, that the size of the national product fluctuates with time, is a common part of our lives, and it has been observed since at least two centuries1. For that matter, it is not very surprising, because the national product originates from the uncoordinated and uncontrolled actions of individuals in the society. The other economic quantities also fluctuate, in accordance with the national product, such as the consumption and the investments. Although all economic quantities are mutually related, their changes with time can be different. This paragraph concerns the fluctuations of the national product, because it is the best measure for the social wealth.
It is common to classify the fluctuations according to four categories:
The reader is warned, that the study of business cycles is very speculative. It can naturally not be denied, that the development of the national product has its peaks and troughs. But whoever tries to discover some regularity, runs the risk to get entangled in chimeras and illusions. Each model of th business cycle is by necessity merely a hypothesis. Thus De Wolff develops a model, where the long cycle has a period of approximately 45 years2. This makes the distinction between the trend and the conjuncture diffuse. On the other hand the neoclassical economists believe, that the economic system is always in equilibrium. In their eyes the disturbances are generated by coincidences.
Yet it is understandable, that economists are fascinated by the theory of business cycles. For the fluctuations can have desastrous consequences for the human well-being. Notably during the economics troughs (sometimes called the baisse or low conjuncture) the economic activity decreases, so that the unemployment rises and with it the poverty. Research results have been published, for instance in the book of De Wolff, which show that during the baisse people no longer have a mind to marry. An extremely deep recession will increase the human dissatisfaction to such an extent, that they call in question the ruling order. This may result in a civil war.
In the simplest model it is assumed, that the economic prosperity and recessions have a constant duration, a regular behaviour, with each time amplitudes of comparable size. It is tempting to model the fluctuations by means of a sinus function (sinus curve, sinoïd). She is sketched in the figure 1. The behaviour of this function consists of a peak, followed by a trough, each with a duration of T/2, where T is called the period of the sinus. The sinus function is an infinite chain of this pattern, with seamless connections. One single sinus movement with a period T is called a cycle.
The figure 1 shows, that the cycle can be divided in different phases. Thus the chain high-conjuncture and low-conjuncture is formed, also called hausse and baisse. A somewhat more refined phase model will split those two in respectively the prosperity / drop and the recession / recovery. The most important element in the figure 1 is the top of the business cycle, which has the telling name crisis. This is the moment, where the activity starts to stagnate, and the people lose their hopes and dreams for the future. The theory of the business cycle depicts a human catastrophe3.
The figure 2 illustrates in a succinct manner the various views of different economists with regard to the business cycles. She displays two series of data from the period between the years 1840 and 2000, which claim to indicate the peaks and troughs of the cycles. The downward blue arrows point to the years on the time-line, where the economy reached its lowest level. The upward red arrows mark the zenith of the economy, and therfore also the time of the crisis.
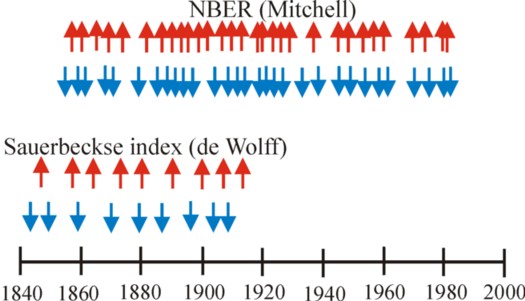
Sam de Wolff uses for his interpretation the index numbers of Sauerbeck4. In fact Sauerbeck computes a price index, and limits his analysis to England. In the nineteenth century the data about the national product were hardly available. Yet the index is relevant, because his behaviour is similar to the cycle of the national product. They are variables, which "coincide" in time, as it were. In general the prices rise during the prosperity, and they fall during the recession. Furthermore at the time England was the dominant economic power, so that his economy is a measure for the global trade.
The method of the National Bureau of Economic Research (NBER) in the United States of America (USA) has originally been invented by the economist Wesley Mitchell. This series only concerns the USA themselves. In the beginning of the twentieth century the economic power of England waned, and after the Second World War the USA became the undisputed world leader (certainly in the economy). The NBER data in the figure 2 are taken from the book The business cycle by the economist H.J. Sherman5.
In the NBER series the economic peaks and troughs are determined by means of a set of various economic variables. It is probable that Mitchell has used mainly price indices for the nineteenth century. However, in the twentieth century many more statistical data became available. In any case after the Second World War the peaks and troughs of the NBER series turn out to coincide with those of the national product of the USA6.
The differences between the series of De Wolff and Mitchell is telling. It can be argued, that during a large part of the nineteenth century the American economy was still under-developed. Then it is conceivable, that foreign crises exerted little influence. But precisely in those early years the USA were still dependent on Englang. At the end of the nineteentyh century the USA had already become a world player. Then the global business cycles were observable in all trading states, albeit that national peculiarities were present7.
Moreover, De Wolff himself asserts, that the "ups and downs" are an international phenomenon. He gives tables of the index of the American wholesale prices from 1825, and finds a similarity with the extremes of Sauerbeck8. De Wolff identifies the Sauerbeck's fluctuations also in the various French and German index numbers. Moreover, from approximately 1890 onwards De Wolff analyses also other indices, such as the change in the trade in raw materials or the installation of new equipment. Here it concerns branches, which are rather sensitive to the fluctuations in the general economic activity.
The empirical research of De Wolff contains an impressive three chapters and 150 pages in Het economisch getij. Therefore one is inclined to be totally convinced. Nevertheless, the results of Mitchell are not mentioned, even though at the time they were available and deviate from the conclusions of De Wolff. This is evidently unsatisfying. However, your columnist does not feel called upon to act as a referee.
Fortunately, there are also similarities between both series. It is apparent that the economic fluctuations deviate from a sinusoïd. Sometimes the peask and the trough almost coincide. This can be observed in the series of De Wolff for 1857 and 1907. In the NBER series it occurs more often, because there the cycles are fairly short. Extremely fast changes (within a year) occur in 1919, 1945, 1953, 1969 and 1980.
Besides it is clear, that the period of the cycles is by no means constant. De Wolff believes that some regularity is present. Until 1855 the period T would be equal to ten years. Next she would be nine years until 1882, and subsequently eight years. In the NBER series the differences of T are even larger. The average period of a cycle is four to five years. But that average is distorted by the long cycles during the wars. When those are left out, then the period is only three to four years. Nevertheless the NBER series also contains some long cycles in times of peace, such as around 1873 (T=8 years), and some extremely short ones as well (T=2.5 around 1860, 1920 and 1980).
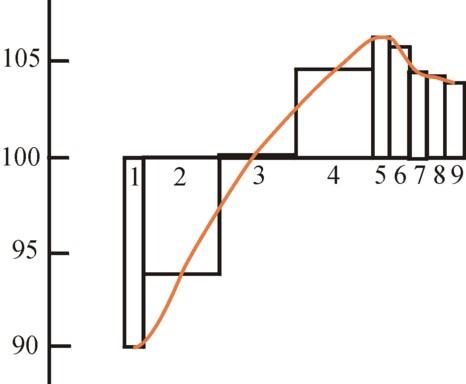
This raises the question about the sense of business cycle research, when the supposed "waves" are so irregular. Sherman acknowledges that both the period T and the vertical amplitude A of the cycle are unpredictable. Nevertheless he still manages to determine a common shape for the seven cycles after the Second World War (from 1949 to 1982). His results for the national product are shown in the figure 3. The vertical amplitude is normalized on the average national product during the cycle, and thus it corresponds to a deviation in terms of percentage9.
The first trough is located in the phase 1 of the figure 3. The peak is located in the phase 5, and the next trough in phase 9. The time between the phases 1 and 5 is divided in three time intervals 2, 3 and 4 of equal length. In the same manner the time between 5 and 9 is divided in three intervals 6, 7 and 8 of mutually equal duration. Thanks to this division in 9 phases the diversity in time behaviour among the cycles can be more or less mastered. The orange-red coloured curve crosses the intervals in the middle, and thus sketches the continuous change of the national product.
It is immediately obvious from the figure, that in the period 1949-1982 a tendential growth is present. The increase of the national product during the cycle is an ample 14%, expressed in per cent. Apparently the NBER method does not remove the trend-component10. It is also interesting, that the duration of the recovery and the prosperity together is about three times as long as the total of the drop and recession. It is obvious that this latter phenomenon is also present in the figure 2.
There exists a large variety of theories about the business cycle. As an illustration the table 1 gives a survey of the various variants, which can be found just in the marxist paradigm11. All these theories, and some more, can also be found in other paradigms. Incidentally, Karl Marx is an important source of inspiration for both De Wolff and Sherman. The variants in the table 1 are mono-causal, that is to say, they identify a single cause for the economic crisis. However, a crisis may as well originate from an (unfortunate) conjunction of circumstances. Such explanations of the business cycles are called poly-causal. This allows for an almost infinite field of theories about the business cycle.
| production | circulation | psychical | conflict | capital | |
|---|---|---|---|---|---|
| over-accumulation | realization | bottle neck | psychologic crisis | political crisis | capital circulation |
| 1. under-consumption 2. disproportions | 1. wage squeeze 2. price span | ||||
It is instructive to study each of the five columns of the table 1. The explanations in the productive sphere are closely related to the ideas of Marx. In the over-accumulation theory it is assumed, that the expansion of the equipment derails. The competition forces the producers to advance the mechanization. But in the end the profit can no longer grow at the same rate as the invested capital. The profit rate collapses and announces the crisis.
The concept of realization refers to obstacles, which hinder the sales of the product on the market. The supply of products can exceed the demand on the market. When an excess of consumer goods is formed on the market, then this is called an under-consumption. The wage level has not adapted to the possibilities. On the other hand, when one has an excess of investment goods (equipment), then this is called a disproportion (namely, in the economic structure of the branches).
The concept of the squeeze (bottle neck) refers to a possible scarcity in the available resources and production factors. For instance in the prosperity the growing demand for labour can push up the wage level. In this situation the prices of the raw materials also tend to rise. Their production can be expanded merely in a gradual manner, so that a situation of scarcity is created of its own accord. A shortage of production factors raises the production costs, which results in a lower profit.
The theories of the psychological crisis have a subjective character, For instance the famous economist J.M. Keynes stated, that the actions of the entrepreneurs are basically driven by the animal spirits. There is a tendency to over-react, when changes occur. Moreover the herd-instinct plays an important role, so that the over-reaction is massive. Conflict theories, such as the theory of the class struggle, describe the economic development as a struggle for power. The economic situation will sometimes favour one group, and then another. The structure of the social system creates instability12.
The crisis theories with respect to the circulation of capital assume, that the capital circulation will eventually falter. The capital passes through the phases production factors → end products → money capital. A hitch will of itself become poly-causal, because she affects all economic spheres (production, distribution, circulation and consumption). The financial sector is of itself not a source of crises, but it does tend to aggravate them.
At this point is may be desirable to explain the occurrence of disproportions. In the hausse an above-average quantity of goods is produced, including durable ones. This concerns among others the capital goods, such as the productive equipment. These goods wear off and are discarded during a period of many years. When the lifetime of certain capital goods are more or less comparable, then their replacement will again cause a hausse. This idea of the shockwise replacement of investment goods forms the foundation of many old theories of the business cycle.
The interesting aspect of the theory of shockwise investment is, that she can explain the deviations of the conjuncture with regard to the sinus shape. Namely, there is a wide variety of capital goods.
A composition of the Kitchin, Juglar and Kuznets will exhibit interference, where the result will be an irregular cycle. Incidentally, according to the Fourier analysis any arbitrary curve can be decomposed into a sum of sinusoids. It does require a certain good will to believe this speculative economic theory. In any case De Wolff and Sherman do not employ this decomposition of the investments.
| exogen | endogen | ||
|---|---|---|---|
| external shock | demand | supply | poly-causal |
| 1. war 2. harvest 3. government | 1. multiplicator-accelerator 2. under-consumption | 1. wage squeeze 2. over-investment 3. excess of credits | profit squeeze |
The table 2 displays the classification of theories of the business cycles according to Sherman in The business cycle13. The comparison with the table 1 proves, that apparently any categorization is subjective. Whereas Müller distinguishes between the psychical and political sphere, Sherman combines these in the category of exogenous theories. The multiplicator-accelerator theory is an ingenious mathematical model, which is post-marxist. With some good will she can be equated with the theory of disproportions. The excess of credits (monetary over-investment) refers to an excessive increase of credits, resulting in a rising rate of interest, which undermines the profit of the entrepreneur. The profit-squeeze theory is explained in the next paragraph.
Alfred Müller defends in Die Marxsche Konjunkturtheorie (see the footnotes) the mono-causal theory of over-accumulation. The crisis starts in the productive sphere, because the eternal competition on the markets pushes the degree of mechanization upwards. The additional capital must be at least as efficient as the existing stock of capital. In the beginning this is easy, because the productivity of labour rises. However, once the moment will come, where the human inventiveness will falter. This moment announces the fall of the rate of profit. And capitalist production without profit is not viable, at least according to the common opinion. The crisis begins14.
De Wolff embraces the model of the Juglar waves. In imitation of Marx (hence the preference of some for the expressions Marx waves). In a previous column it has been explained, how according to De Wolff the business cycles are generated by the fluctuations of the sun spots, which influence the yield of the harvest. After that in the second part of the nineteenth century the industrial development obtains its own dynamics. In this way De Wolff explains the shortening of the period of the cycles, so that they get out of step with the sun spots.
Besides this mechanism of a structural disproportion De Wolff predicts another mechanism of over-production. This second aspect of his theory of business cycles has been described in the column about the development of the rate of surplus value. The entrepreneurs keep investing all their capital, without paying attention to the rising labour productivity. They believe that they can always sell their complete supply of products, but this is evidently a misconception. The capitalist market is too chaotic for adequate reactions in response to the market developments, which originate from the technological progress. Therefore a continuous technical progress would confuse the markets. De Wolff argues that the progress advances merely in a shockwise manner, by means of destructive crises with a limited duration, so that the economy can again follow the usual course of things15.
Remarkable is also the theory of business cycles by Sherman. This theory is poly-causal, because the under-consumption and over-investments both create a crisis. She is called the profit-squeeze theory, or also the nutcracker theory, because of the two causes which interlock in a scissor-like movement16. The under-consumption starts in the prosperity, because the profit rises faster than the wage level. The recipients of the profit are the capital owners, and they consume naturally less than the workers. In consequence a falling part of the national income is spent on consumer goods. The demand stagnates.
But there is more. In the prosperity the raw materials become scarce, so that their prices rise. The rising costs lead to a falling profit rate. This decline begins usually already halfway the phase of prosperity. A falling rate of profit stifles the willingness to invest in capital goods. It is paradoxical that the over-investments cause the collapse of the market for the means of production. The hausse suffers from a double profit restriction, namely as a result of the falling demand on the markets and the rising costs of production.
Sherman stresses, that the profit-squeeze model has only a conceptual significance. When the behaviour of the business cycles must be described in a realistic way, then the influence of oligopolies, the international trade, the financial sector, and state interventions must be included in the model.
Finally it is worth mentioning, that all theories in this paragraph describe the conjuncture as an endogenous process, That is to say, the fluctuations originate from the activities in the economic system itself, so from within. At the most an exception must be made for the theory of the sun spots, which is based on an external cause, and thus on an exogenous process.