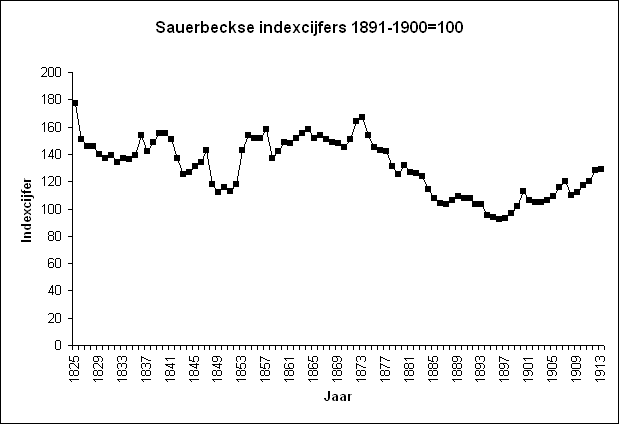
Figure 1: Sauerbeckse index, taken from literature (3)
Since the onset of the scientific research of economics the phenomenon of the crisis has received much interest. In the crisis the economic growth reaches its upper boundary, whereupon during the recession a correction is applied. As this process repeats itself constantly in the historical time, it creates a pattern, which is called the business cycle or conjuncture. In the nineteenth century some scientists thought that the time interval between two crises is more or less constant1. Of course they tried to explain this apparent periodicity of the cycles. It seems reasonable to assume that these uncertain cycles are superimposed on a long-term development of structural continuous growth. For the productivity keeps increasing, just as our material wellfare. Some voices were heard, that advocated to describe the long-term growth in terms of a cyclical movement2.

The Dutch economist Sam de Wolff has done groundbreaking work in describing the economy by means of the dual cycle movement, notably the short cycle with a period of approximately ten years, and the long cycle whose period is five times as long, so about fifty years3. De Wolff elaborates on a publication of J. van Gelderen, who thus may be called the originator. Incidentally, later Van Gelderen moved away from his discovery, after which De Wolff became the leading protagonist of the idea of the long cycle. In the international community the idea of the dual cycle is mainly attributed to N.D. Kondratieff, but Kondratieff developed his hypothesis in 1919-1921, so at least after Van Gelderen4. Even earlier, in 1901, A.I. Helphand (whose pseudonym is Parvus) had written a pamphlet about the long cycle5. Van Gelderen was aware of the text of Parvus. Apparently the text of Parvus was too superficial in order to gain a general recognition.
De Wolff published his first paper about the long cycle already in 1921, and gained with this some international recognition. He attached great value to the possibility of predicting the future course of the conjuncture. In his book Het economisch getij (in English The economic tide) 3 De Wolff actually predicts the Great Depression, that was about to break out in 1929. The belief of De Wolff in the economic predestination originates from his marxist vision on society, in which the social processes are treated in a material-scientific way. Thanks to the law of the large numbers the individual behaviour would spread and be wiped out statistically, so that the future is determined mainly by the ruling social structures and institutions. There remains no room for subjective explanations like those of mass psychology.
The economists at the start of the twentieth century did not yet have the disposal of the empirical data about the gross national product. Compelled by necessity they had to base their research on derived numbers like the price development, and the extent of the product on the branch level6. The prices are a measure of the economic growth, because the rising prosperity increases the aggregate demand. After a while some branches reach their maximum production capacity, which might make the demand larger than the offer. The equilibrium can only be maintained by raising the product price. The extension of the product capacity (new factories) is in general toilsome to such a degree, that she requires a couple of years time.

De Wolff has indeed presented in his book a large collection of statistical material, in order to support his theory. His most complete time series is the index number of Sauerbeck, which measures the English price level. This index is available for the period from 1825 until 1913, so during the era when Great Britain controlled the world economy both in the production and in the finances. De Wolff shows in his book the development of Sauerbeck´s index both in graphs (p.58, p.61) and in tables (p.62, p.66, p.71). In the tables he marks in addition the peaks and troughs of the short cycles. He calculates the relative index with respect to the average value, that the index obtains in the interval 1891-1900. Figure 1 shows the development of this relative index in a graphical form7.
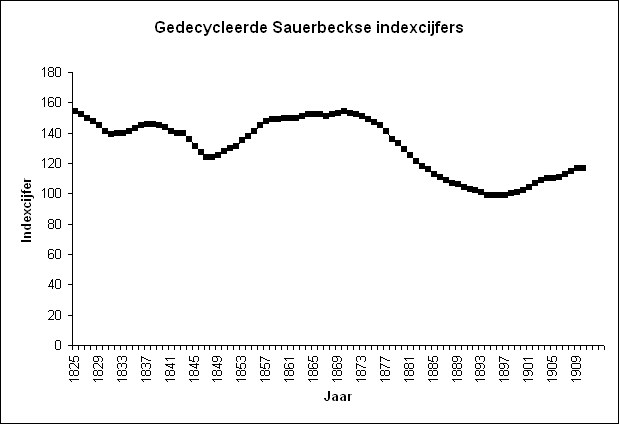
The figure 1 shows clearly how the conjuncture changes from year to year. De Wolff wants to eliminate the short cycles, that is to say the cyles with a short period, from his statistical material, because they obscure the long-term development. Therefore he performs an operation on the relative index, which he calls decycling. This means, that for every year he uses not Sauerbeck's index itself, but its average over a period which extends from the four years preceding the year to the four following years8. The result of the decycling is shown in the figure 2. De Wolff concludes on the basis of this figure, that for the period 1825-1913 the first peak of the long cycle occurs in 1821. Thereafter a long downturn starts, which he calls the ebb-tide. In 1847 the break occurs, and the prosperity starts, which lasts until 1870. De Wolff calls this the spring-tide, because in this year the normal cyclical conjuncture is superimposed on the rising long-term trend. The ebb-part and the flood-part form together the long cyclical movement, which lasts from 1821 until 1870, so for fifty years.
Figure 2 reveals between 1834 and 1838 a rise in the price level, which is rather unexpected, because this part lies in the middle of the ebb period. According to De Wolff this abnormality is caused by an exceptional financial crisis, which around 1839 forced up the prices. Since this crisis is merely of a financial nature, she should be separated from the development of the productive conjuncture.

According to De Wolff the second long cycle movement occurs between 1871 and 1910, namelijk first the ebb period 1871-1894, and then the spring-tide 1895-1910. Apparently the cycle length has diminished somewhat, namely to a total of forty years.
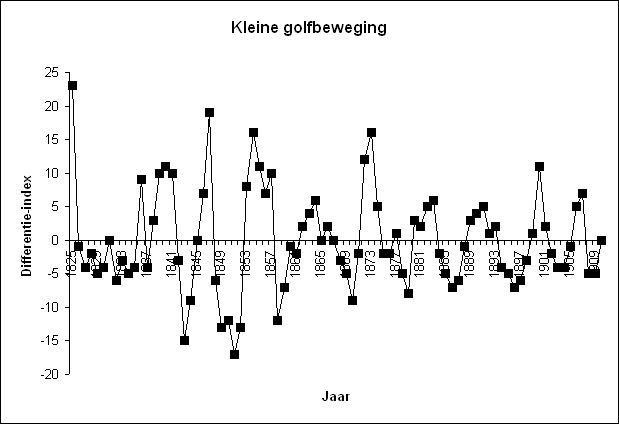
Now that the long cycle movement has been determined for the era 1825-1913, the development of the normal cyclical conjuncture can once again be studied. She can be found by subtracting the long cycle from the Sauerbeck's index numbers. The result of this operation is shown in the figure 3, in the form of a sinus curve, which has peaks and troughs on both sides of the horizontal axis. De Wolff has shown with these data, that each long cycle can contain precisely five short cycles. This discovery fixes the dual cycle movement completely in terms of its parameters.
After the Second Worldwar the global economy has developed prosperous in such a manner, that the interest in the long term shrinkage has waned. In the seventies and eighties of the twentieth century the economic growth came to a halt, and changed into a stagnation and a deep recession. Since then in some circles doubt has again risen with regard to the natural structural growth, and this has lead to a revival of models with a long term cycle. An intriguing example is the model of G. Duménil en D. Lévy9, which assumes a long cycle of about ninety years, so about twice as long as the older models. This deviating model illustrates, how apparently the existing empirical data can be described by clearly different combinations of cycles. Therefore a certain reservation with respect to the reliability of the long cycle models is justified. Nevertheless, they remain valuable, because they stimulate critical meditations and they moderate the belief in structural growth.